Healthcare Data Projects & Case Studies
Explore the projects I've worked on throughout my career and the tools I used to solve them.
HIPAA De-Identification Pipeline
The ProblemHealthcare organizations need to analyze patient data for operational insights, but strict HIPAA regulations prevent the use of identifiable patient information (PHI/PII) outside of production systems.
What I BuiltA reusable Python toolkit that automatically de-identifies patient data to meet HIPAA Safe Harbor standards.
The ResultReduced de-identification time from hours to minutes with a production-ready, open-source toolkit now available to any healthcare organization.
Note: The demo app may take a few seconds to load if inactive. For production use with real patient data, please download the toolkit from GitHub and run it locally in your secure environment.
Provider Data Deduplication Case Study
The ProblemDuplicate physician records from inconsistent data entry were causing patients to appear in wrong provider queues, disrupting care coordination and creating operational bottlenecks.
What I BuiltIdentified the root cause of those duplicate records, quantified the scope of the problem, and developed both immediate workarounds and long-term solutions.
The ResultRestored accurate patient-provider matching for 1,500+ affected records and eliminated queue assignment failures that were delaying patient care.
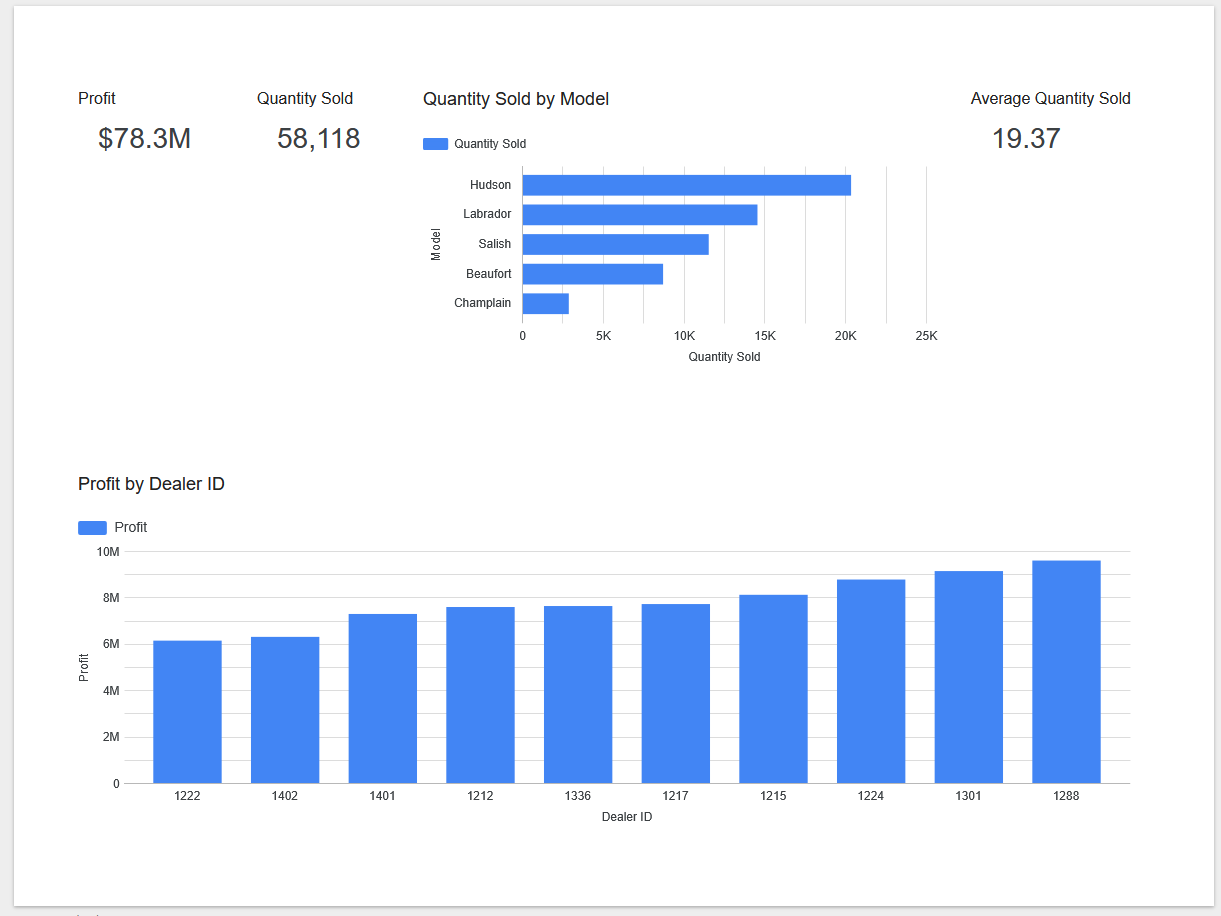
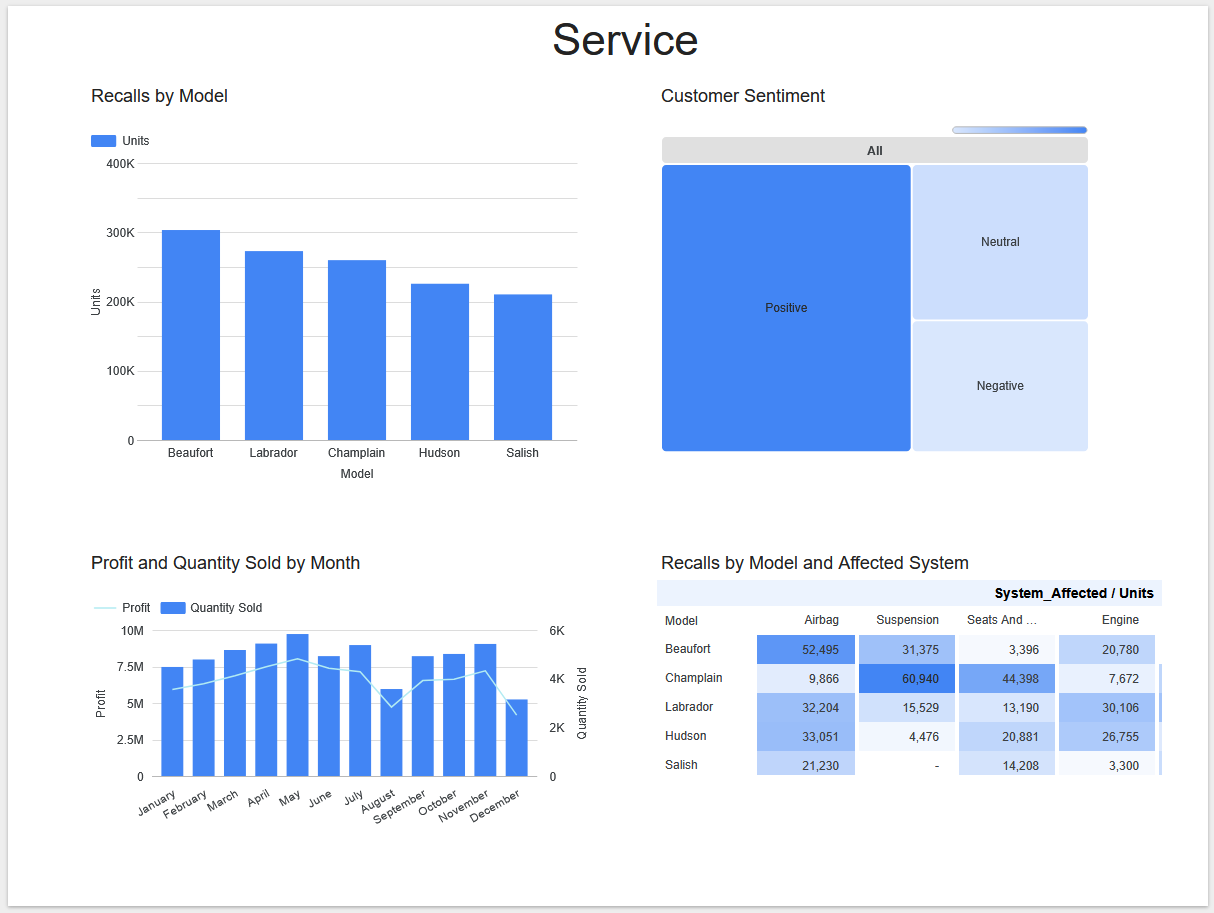
IBM Data Visualization Final Project - Sales & Service Dashboards
The ProblemAs part of the coursework for Coursera's IBM Data Analyst Professional Certificate program, I had to build two dashboards using Looker Studio as a final project for their Data Visualization and Dashboards with Excel and Cognos course.
What I BuiltUsing the provided auto sales dataset, I created two dashboards: one for sales performance tracking and the other for service operations monitoring.
The ResultWhile this isn't healthcare related, I believe the same patterns found in these dashboards can be applied to quality metrics and operational reporting in multiple industries.
I also earned 100% on the final project evaluation, earning a certification for that course, and wanted to show them off. 😁
Additional Work
Fun, Personal Projects
Slump Dog Sluggers - a Tableau Public dashboard using a PostgreSQL database that tracked individual Philadelphia Phillies’ batting performance during the 2025 season. Designed a multi-timeframe rolling average analysis (7-game, 14-game, 30-game windows) to try and test how big of a factor does age play in a player’s ability to bounce back from a slump.
View on GitHub View on Tableau Public
The $97.7M Hit Drought Tracker - a Streamlit dashboard set up to give a quick snapshot of the stats for the Phillies’ top 4 hitters during the 2026 season and testing how effective they are compared to the rest of the team. Also includes in memoriam, injured reserved, and restricted list trackers.
View the tracker here: Streamlit
Workout Wednesday Challenges
Building technical skills through weekly Tableau visualization challenges that require creative problem-solving, dashboard design, and advanced techniques.
View my solutions on Tableau Public.
All project code and documentation available on GitHub.